![[CC0], via Wikimedia Commons](http://thegreatrecession.info/blog/wp-content/uploads/Bear-kills-bull.jpg)
The 2018-2019 stock bear market is still roaring among several major indices. It has broken all the market’s FAANGs and still shows no signs of backing off.
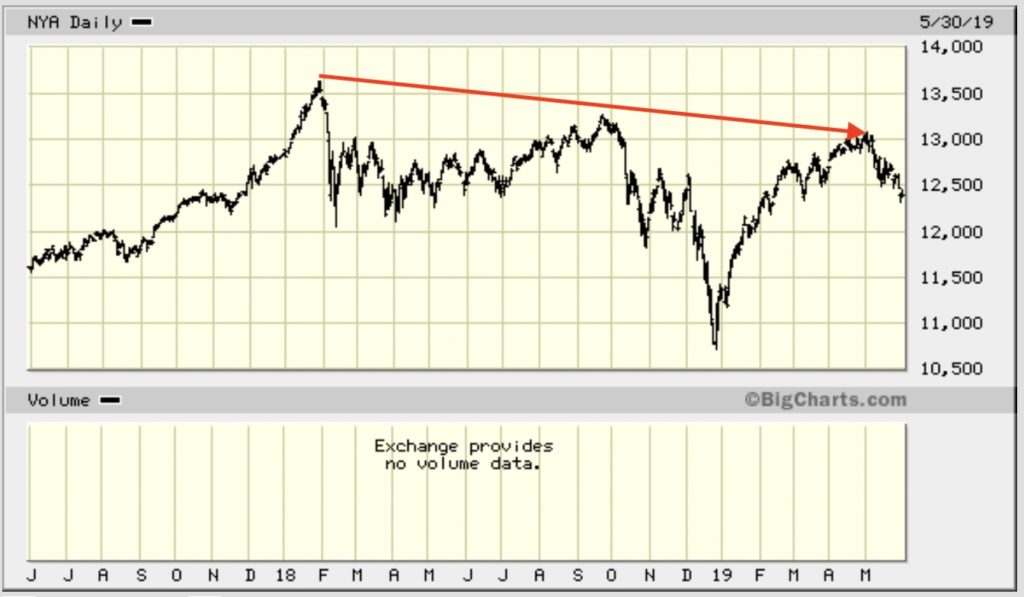
The New York Stock Exchange Composite bear market

One of the broadest indices for the US stock market, the NYSE, entered a bear market in January of 2018 (falling to the point where it could be classified as a bear market (down 20% or more) in December of 2018). It has not recovered from its approximately 22% fall after two tries that now represent a downward trend line for the index’s subsequent major peaks. (By “entered” I’m talking, not about the date on which an index was first down 20% from its previous highest point, but the date on which it began the trip down that eventually wound up passing the 20% mark.)
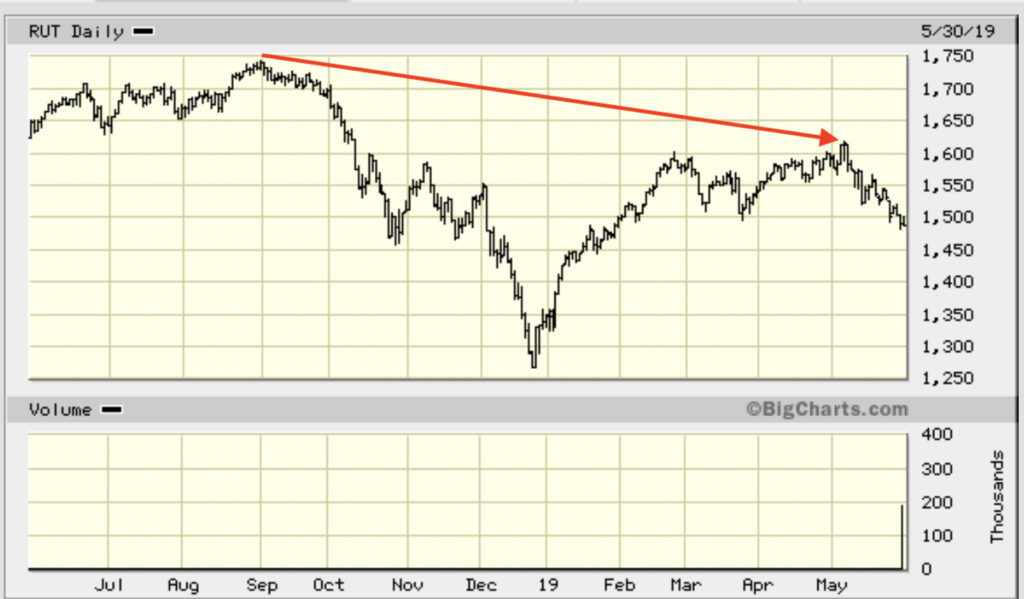
Russel 2000 stock bear market

Another one of the broadest major indices of the US Stock market, the Russel 2000, entered a bear market on August 31, 2018, falling about 28% by December, and has never even come close to recovering from its fall, even at most recent peak.
Thus, by some of its broadest measures, the US stock market remains a bear market.
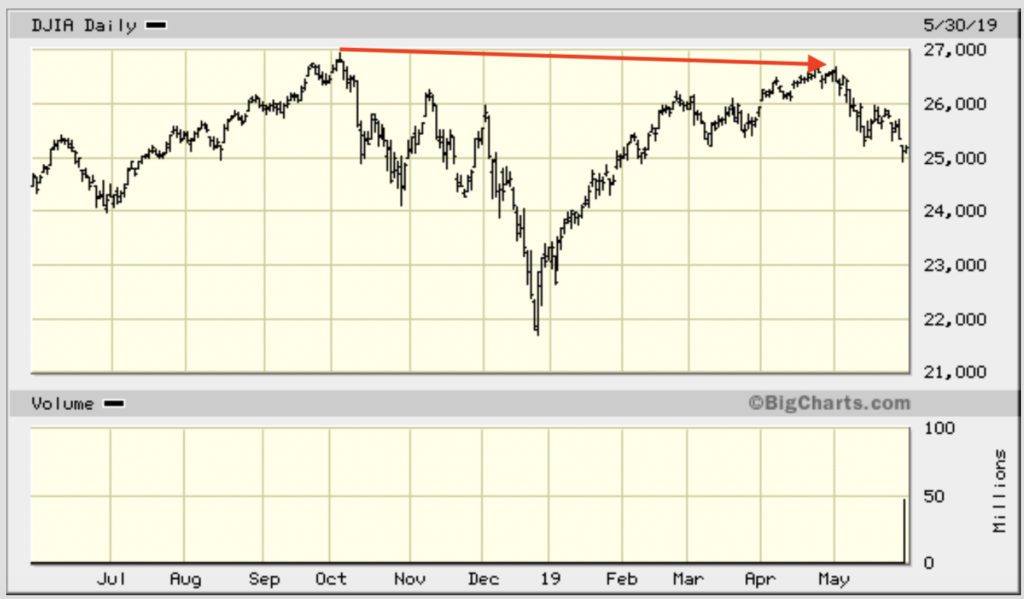
Dow Jones Industrial Average (DJIA) bear market

The oldest and most august of US stock market indices, the Dow Jones Industrial Average (DJIA), began its decent into a bear market a month after the broader Russel 2000 on October 3rd and also has not recovered to its former summit. It was setting a multi-month string of new highs and had just set two new daily highs in a row when it toppled.
The Dow Jones Transportation Average entered a bear market two weeks before the DJIA on September 14, 2018, from which it also has never recovered. (Transportation stocks are seen as leading indicators, which they proved to be in this case. What does it say that these trend leaders are leading the latest plunge at a steeper rate than their sister, the DJIA?)
The bear’s FAANGs all broke off
Here is an interesting graph that shows the individual bear markets that each of the FAANG stocks entered in 2018. The breaking of the FAANGs started with with Netflix and Google (Alphabet) in the first half of summer:

This chart (as well as the quote below) stops at November 23rd when it was made, but the chart’s an interesting composite of these five stocks so I used it even though the stocks continued to fall further. These stocks were known as “the generals” because they relentlessly led the Great Recovery charge uphill throughout the present decade … well, until they didn’t. Because they attained umerited lofty heights, some of them crashed more than 40% last year.
Over recent years, there hasn’t been a safer bet than big tech – specifically the FAANG stocks, which include Facebook, Apple, Amazon, Netflix, and Google’s parent company Alphabet. But in the financial world, this feeling of euphoria can be turned upside-down very quickly. Since the summer, the five tech giants combined have lost close to $1 trillion in market capitalization from their peaks. Now the FAANG stocks have officially slipped into a bear market, with investors blaming rising interest rates, slumping sales forecasts, possible government intervention, and bubble-like valuations as reasons for the reversal in fortune.
Visual Capitalist
Largely because of the crash of these five leaders, the Nasdaq composite index and Nasdaq 100 stock index both hit that 20% point to officially be declared bear markets on December 21 of 2018. Both indices recovered marginally since, but are on their way back down. Other major tech stocks that entered their own bear markets and went down more than 40% included Twitter and Snapchat.
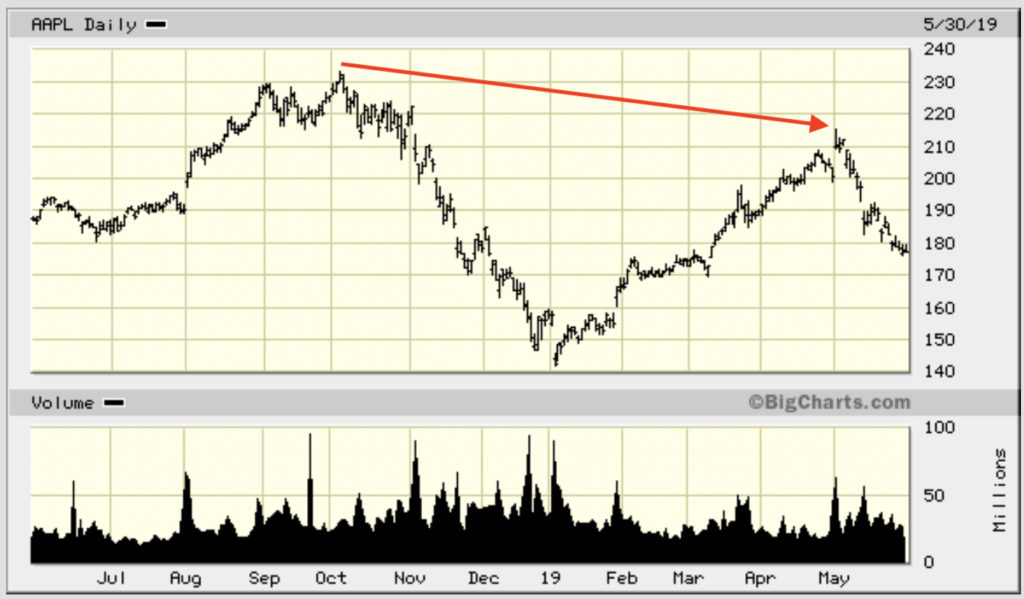
The bear takes a bite out of the Apple

Apple became the United State’s first trillion-dollar corporation in 2018. Then, starting as a big surprise in October, it fell within a hair of 40%. The once-trillion-dollar big Apple has never recovered. However, because permabulls like to manipulate number in the direction of their favorite narrative, some claim it did because it went back up 20%, matching the minimum amount by which an index or stock can move downward and be called a bear. I think that really represents how biased and goal-seeking the permabulls of the market are because you would never call any other market “recovered” if it did not reattain the height from which it fell. Can you imagine any permabulls saying the gold market had recovered from being a bear market if the price of gold dropped 40% and then only recovered 20% (especially when the 20% is taken off a lower number than the the original fall was measured from and so represents less of a move back up than 20% represents for a downward move).
However, even those who determined to be a airhead permabulls of the kind described above, in Apple’s case have to admit that Apple has re-entered its bear market in barely over half a year! Because of the extent to which the Trump Trade War with China threatens it, Apple is back down 39% below its last all-time peak.
A number of the usual bullish analysts are now warning that stocks could be entering another correction due to the Trump Trade Wars. Dream on if that is all you think this is. The last “correction” was a bear, and for many indices (and individual stocks like Apple) it never ended. I made my second prediction for 2019 last week by stating we’re heading right back into the bear’s mouth:
Prediction: The cub is coming out of hibernation and is about to grow up. The first quarter’s entirely unmerited, euphoric rise in stocks has paved the way for the second quarter’s volatility. Because China trade problems and all the other global problems have not been properly weighted by the market, which has chosen to believe a greater trade war will be averted, the market is poised for another collapse.
“You Know Things are Falling When…“
By that, I meant a return roughly to its last bottom, but possibly further because I’ve been saying for last three years that the bear that would (and did) roar into life in 2018 would likely take a couple of years to fully play out, maybe more and would have many large rallies and larger falls along that journey. I like the way one Morgan Stanley strategist who was quite bearish last year — Michael Wilson — called this “a rolling bear market.” Wilson, who called 2018’s bear market quite accurately, has now raised his ante to put the nation on “recession watch” this week:
Many recent reports reflect April data, “which means [the economy] weakened before the re-escalation of trade tensions,” Wilson continued. “In addition, numerous leading companies may be starting to throw in the towel on the second half rebound–something we have been expecting but we believe many investors are not.” Wilson was one of the most bearish stock strategists last year, defending his initial S&P 500 call of 2,750 for year-end 2018 without adjusting it throughout the year. By the end of the year, his call was the most accurate of any strategist tracked by CNBC…. Morgan Stanley economists have lowered their second-quarter U.S. GDP forecast to 0.6% from 1.0%….. “The April durable goods report was bad, particularly the details relating to capital goods orders and shipments. Coming on the heels of last week’s crummy April retail sales report, it suggests second quarter activity growth is sharply downshifting from the first quarter pace, ”
CNBC
Which, if he is as right a he was last year, means things are moving solidly in my direction … to which the Trump Trade War with China will only be a lubricant on the downhill run. Wilson makes a number of other good points. I recommend the article.
And, thus, closes the worst May since … once again … those Great Recession years — 2010. Liked it? Take a second to support David Haggith on Patreon!
